
A regular observation around the zones where closely related species meet, mate and produce offspring (hybrid zones) is that mitochondrial DNA of one of the species extents into part of the range of the other species (asymmetric mitochondrial DNA introgression). The classic explanation for this pattern is that positive selection has pulled foreign mitochondrial DNA into a species’ range, because it has some kind of advantage over native mitochondrial DNA. An alternative explanation is that the hybrid zone between the two species has moved, while the mitochondrial DNA of the receding species was left behind in the invading one.
 This figure shows how mitochondrial DNA can be transferred across the species boundary via introgressive hybridization. Large circles reflect the nuclear DNA composition of individuals and small ones their mitochondrial DNA type. There is an initial hybridization event between the members of two species, a red female and a green male. The F1 offspring contain a mix of red and green nuclear DNA, as this is inherited from both parents, but only red mitochondrial DNA, because mitochondrial DNA is only transmitted via the mother. Over subsequent generations, admixed females mate (backcross) with green males. In time the red nuclear DNA dilutes out and in effect we end up with a species that, from the nuclear DNA perspective, is completely green, but that possesses red mitochondrial DNA.
How can you distinguish between two processes that would basically result in the same pattern? A key difference is that according to the first explanation the hybrid zone is stable, while according to the second explanation the hybrid zone moves. Therefore, independent insight into hybrid zone mobility could help figure out what caused asymmetric mitochondrial DNA introgression.
 This figure shows two scenarios that could result in geographically asymmetric mitochondrial DNA introgression. We have a green and a red species. The background reflects nuclear DNA composition in space. Circles reflect the spatial distribution of mitochondrial DNA. The black bar represents the hybrid zone between the two species and the grey boundary the geographical overturn between the two mitochondrial DNA types. In both panels mitochondrial DNA of the red species has introgressed into the green one when they started hybridizing. In the top panel the green species subsequently outcompetes the red one and the species boundary moves towards the left. The green individuals at the frontier possess red mitochondrial DNA, and so does their offspring that gradually replaces the red species. Therefore, red but not green mitochondrial DNA is spread into the region of species replacement via the green species (where red mitochondrial DNA is already present in the red species). Hence, the location of the geographical overturn between the two mitochondrial DNA types remains the same. In the bottom panel the location of the hybrid zone between the green and the red species is stable. However, the red mitochondrial DNA is beneficial to the green species and natural selection pulls it further and further into the green range over time. In effect, the geographical overturn between the two mitochondrial DNA types moves towards the left.
In a paper published in BMC Evolutionary Biology we look at a crested newt case of extensive mitochondrial DNA introgression on the Balkan Peninsula. We first delimit a ca. 54,000 km² area in which T. macedonicus contains T. ivanbureschi mitochondrial DNA. This introgression zone bisects the range of T. ivanbureschi, isolating an enclave from the main range. This enclave suggests hybrid zone movement as the cause of the observed asymmetric mitochondrial DNA introgression: it is unlikely that T. ivanbureschi managed to move across a large region inhabited by T. macedonicus (as newts cannot fly), while it is easy to imagine that T. macedonicus locally replaced T. ivanbureschi in the area between the enclave and the main range of T. ivanbureschi. Considering the high similarity of introgressed mitochondrial DNA haplotypes to those found in T. ivanbureschi today, introgression must be of recent origin.
 This figure shows the geographical distribution of the two crested newt species and their mitochondrial DNA as Thiessen polygons (a.k.a. a Voronoi diagram). Each polygon covers the area that is closer to its corresponding crested newt locality than to another one. Green and blue polygons represent T. macedonicus and T. ivanbureschi localities with T. macedonicus and T. ivanbureschi mitochondrial DNA, respectively. The red polygons represent T. macedonicus localities with T. ivanbureschi mitochondrial DNA and the orange ones T. macedonicus localities where both T. macedonicus and T. ivanbureschi mitochondrial DNA are present. To delimit the introgression zone, we combined the orange and red polygons. The purple at the top reflects the area where other Triturus species are present, while the grey land (and white sea, obviously) is devoid of Triturus newts.
We make use of species distribution modelling (a.k.a. ecological niche modelling) to obtain insight into hybrid zone movement. In species distribution modelling you determine the ecological conditions at locations where you know a species is present and then you determine where else such conditions occur. Furthermore, if you have reconstructions of ecological conditions for past time periods, you can approximate past ranges. Most hybrid zones observed today were established after the last glaciation of the Quaternary Ice Age came to an end. Species that had their ranges reduced during glacial conditions expanded them again as the climate ameliorated and came into contact with other species that were doing the same. This makes the period since the end of the last glaciation particularly interesting to study with species distribution modelling. Fortunately, climate reconstructions for the Last Glacial Maximum (about 21,000 years ago) and the mid-Holocene (about 6,000 years ago) are available. We construct species distribution models for both crested newt species based on current climate data and project these on climate reconstructions of the two past time slices.
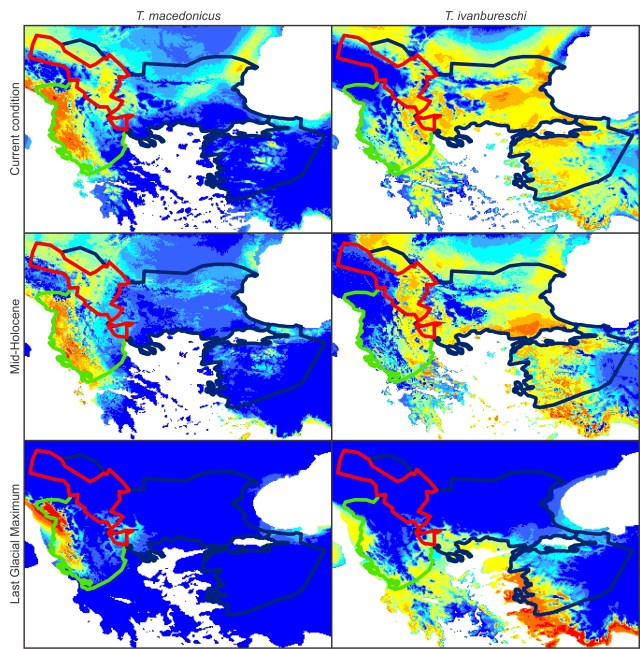 This figure shows species distribution models for T. macedonicus (left) and T. ivanburschi (right) projected on climate layers for the Last Glacial Maximum (bottom), Mid-Holocene (middle) and the present (top). The warmer the color, the more suitable the area. The blue line delineates the T. ivanbureschi range (with T. ivanbureschi mitochondrial DNA). The green line delineates the T. macedonicus range where its own mitochondrial DNA and the red line where this species carries introgressed T. ivanbureschi mitochondrial DNA. As you can see, the introgression zone was inhospitable for either species during the Last Glacial Maximum, suggesting that the pattern we observe today was established at a later stage. However, the zone would have been habitable again at the mid-Holocene. Since that time habitat suitability generally increased for T. macedonicus, while it decreased for T. ivanbureschi.
Taken the results of the mitochondrial DNA survey and the species distribution modelling together we can reconstruct a historical biogeographical scenario for this crested newt case. Based on the arrangement of the ranges of the two crested newt species involved (the enclave), and the insight provided by the mitochondrial DNA phylogeographic structure and species distribution models, we favor the hybrid zone movement rather than the positive selection hypothesis to explain the presence of T. ivanbureschi mitochondrial DNA in a big chunk of the range of T. macedonicus.
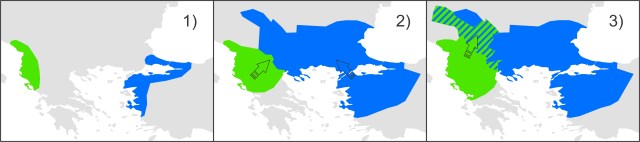 This figure shows a simplified historical biogeographical scenario to explain the observed mitochondrial DNA introgression between the two crested newt species. During the adverse climate conditions of the Last Glacial Maximum, the ranges of T. macedonicus (green) and T. ivanbureschi (blue) were restricted (1). When the climate improved, both species started to expand and obtained secondary contact (2). Subsequently, T. macedonicus invaded area occupied by T. ivanbureschi and locally took over, but as species displacement coincided with hybridization, T. ivanbureschi mitochondrial DNA was left behind in this part of the T. macedonicus range (3).
Reference: Wielstra, B., Arntzen, J.W. (2012). Postglacial species displacement in Triturus newts deduced from asymmetrically introgressed mitochondrial DNA and ecological niche models. BMC Evolutionary Biology 12: 161.

Pingback: Mitochondrial mess-up | Ben Wielstra
Pingback: The final nail in the coffin of Triturus arntzeni | Ben Wielstra