
The different crested newt species typically have very distinct mitochondrial DNA. However, as these guys hybridize like rabbits, often the mitochondrial DNA of one species has locally been transferred (introgressed) into the wrong species. ‘Locally’ can refer to quite an extensive range actually. Species distribution modelling of distinct geographical populations, only recognizable based on DNA divergence, is a good way to test whether they represent cryptic species – multiple species erroneously classified as a single one because no one previously realized they were distinct. However, if you would use mitochondrial DNA to identify the putative species, introgression would cause misidentifications and could lead to under- or overestimation of the ecological niche of the putative species. We explore this problem in a paper just out in PLoS ONE.

This figure shows the setting in which we test the effect of introgressed mitochondrial DNA on niche estimation. The two areas with red dot on the wrongly colored background are causing trouble. If using mitochondrial DNA as a guidance, you would interpret these localities as beloning to the red species, while excluding them from the green or blue species.
Reference: Wielstra, B., Arntzen, J.W. (2014). Exploring the effect of asymmetric mitochondrial DNA introgression on estimating niche divergence in morphologically cryptic species. PLoS ONE 9(4): e95504.
![]()
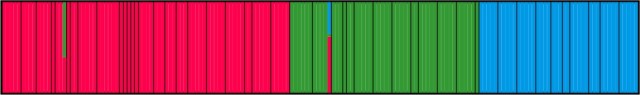 This plot shows individuals (thin bars) within populations (thick bars) roughly ordered from west to east. Based on their genotype, individuals are allocated (0-100%) to three geographical genetic groups (represented by different colors).
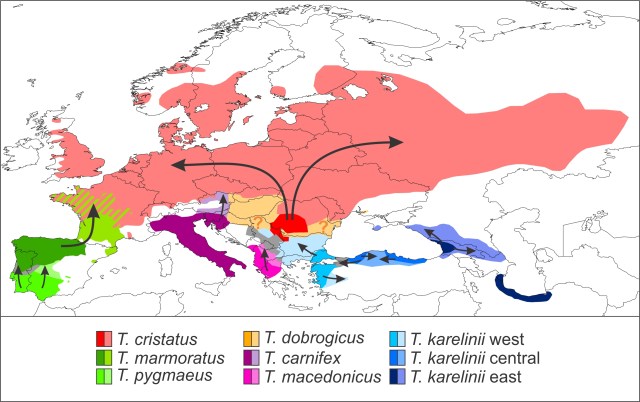
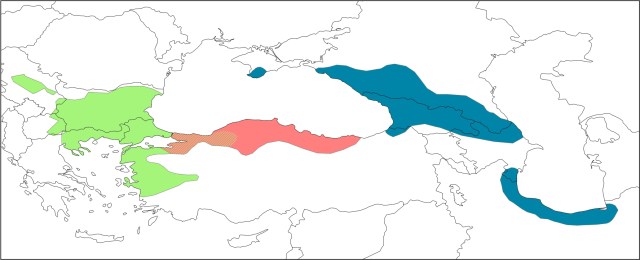 Here you see the three cryptic species that make up the T. karelinii-group of crested newts. An intriguing finding is that asymmetric DNA introgression from the western group into the central group (the red-green hatched area). We suggest that this pattern can be explained by the central group having expanded its range at the expense of the western group, while the two hybridized in the process. An interesting hypothesis to test in a future study!


 This figure shows how mitochondrial DNA can be transferred across the species boundary via introgressive hybridization. Large circles reflect the nuclear DNA composition of individuals and small ones their mitochondrial DNA type. There is an initial hybridization event between the members of two species, a red female and a green male. The F1 offspring contain a mix of red and green nuclear DNA, as this is inherited from both parents, but only red mitochondrial DNA, because mitochondrial DNA is only transmitted via the mother. Over subsequent generations, admixed females mate (backcross) with green males. In time the red nuclear DNA dilutes out and in effect we end up with a species that, from the nuclear DNA perspective, is completely green, but that possesses red mitochondrial DNA.
 This figure shows two scenarios that could result in geographically asymmetric mitochondrial DNA introgression. We have a green and a red species. The background reflects nuclear DNA composition in space. Circles reflect the spatial distribution of mitochondrial DNA. The black bar represents the hybrid zone between the two species and the grey boundary the geographical overturn between the two mitochondrial DNA types. In both panels mitochondrial DNA of the red species has introgressed into the green one when they started hybridizing. In the top panel the green species subsequently outcompetes the red one and the species boundary moves towards the left. The green individuals at the frontier possess red mitochondrial DNA, and so does their offspring that gradually replaces the red species. Therefore, red but not green mitochondrial DNA is spread into the region of species replacement via the green species (where red mitochondrial DNA is already present in the red species). Hence, the location of the geographical overturn between the two mitochondrial DNA types remains the same. In the bottom panel the location of the hybrid zone between the green and the red species is stable. However, the red mitochondrial DNA is beneficial to the green species and natural selection pulls it further and further into the green range over time. In effect, the geographical overturn between the two mitochondrial DNA types moves towards the left.
 This figure shows the geographical distribution of the two crested newt species and their mitochondrial DNA as Thiessen polygons (a.k.a. a Voronoi diagram). Each polygon covers the area that is closer to its corresponding crested newt locality than to another one. Green and blue polygons represent T. macedonicus and T. ivanbureschi localities with T. macedonicus and T. ivanbureschi mitochondrial DNA, respectively. The red polygons represent T. macedonicus localities with T. ivanbureschi mitochondrial DNA and the orange ones T. macedonicus localities where both T. macedonicus and T. ivanbureschi mitochondrial DNA are present. To delimit the introgression zone, we combined the orange and red polygons. The purple at the top reflects the area where other Triturus species are present, while the grey land (and white sea, obviously) is devoid of Triturus newts.
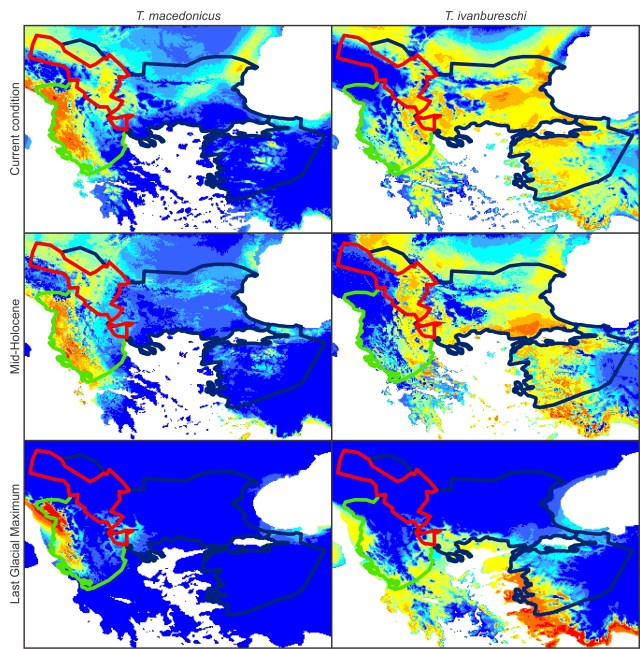 This figure shows species distribution models for T. macedonicus (left) and T. ivanburschi (right) projected on climate layers for the Last Glacial Maximum (bottom), Mid-Holocene (middle) and the present (top). The warmer the color, the more suitable the area. The blue line delineates the T. ivanbureschi range (with T. ivanbureschi mitochondrial DNA). The green line delineates the T. macedonicus range where its own mitochondrial DNA and the red line where this species carries introgressed T. ivanbureschi mitochondrial DNA. As you can see, the introgression zone was inhospitable for either species during the Last Glacial Maximum, suggesting that the pattern we observe today was established at a later stage. However, the zone would have been habitable again at the mid-Holocene. Since that time habitat suitability generally increased for T. macedonicus, while it decreased for T. ivanbureschi.
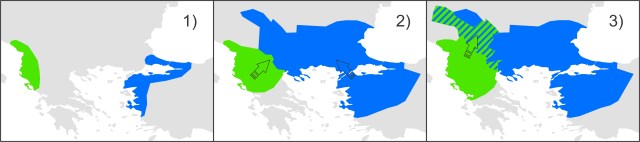 This figure shows a simplified historical biogeographical scenario to explain the observed mitochondrial DNA introgression between the two crested newt species. During the adverse climate conditions of the Last Glacial Maximum, the ranges of T. macedonicus (green) and T. ivanbureschi (blue) were restricted (1). When the climate improved, both species started to expand and obtained secondary contact (2). Subsequently, T. macedonicus invaded area occupied by T. ivanbureschi and locally took over, but as species displacement coincided with hybridization, T. ivanbureschi mitochondrial DNA was left behind in this part of the T. macedonicus range (3).
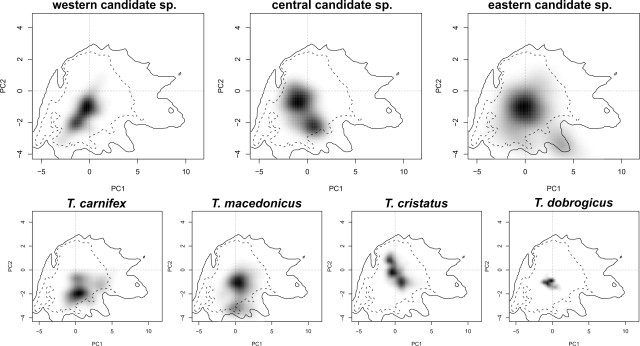 In these squares you see a two dimensional representation of the niche space experienced by all crested newts together. The grey shading reflects the occurrence of each (candidate) species within that niche space.