

On 3 October 2012 I defended my PhD thesis, which can be found here.
On 3 October 2012 I defended my PhD thesis, which can be found here.
A regular observation around the zones where closely related species meet, mate and produce offspring (hybrid zones) is that mitochondrial DNA of one of the species extents into part of the range of the other species (asymmetric mitochondrial DNA introgression). The classic explanation for this pattern is that positive selection has pulled foreign mitochondrial DNA into a species’ range, because it has some kind of advantage over native mitochondrial DNA. An alternative explanation is that the hybrid zone between the two species has moved, while the mitochondrial DNA of the receding species was left behind in the invading one.
 This figure shows how mitochondrial DNA can be transferred across the species boundary via introgressive hybridization. Large circles reflect the nuclear DNA composition of individuals and small ones their mitochondrial DNA type. There is an initial hybridization event between the members of two species, a red female and a green male. The F1 offspring contain a mix of red and green nuclear DNA, as this is inherited from both parents, but only red mitochondrial DNA, because mitochondrial DNA is only transmitted via the mother. Over subsequent generations, admixed females mate (backcross) with green males. In time the red nuclear DNA dilutes out and in effect we end up with a species that, from the nuclear DNA perspective, is completely green, but that possesses red mitochondrial DNA.
How can you distinguish between two processes that would basically result in the same pattern? A key difference is that according to the first explanation the hybrid zone is stable, while according to the second explanation the hybrid zone moves. Therefore, independent insight into hybrid zone mobility could help figure out what caused asymmetric mitochondrial DNA introgression.
 This figure shows two scenarios that could result in geographically asymmetric mitochondrial DNA introgression. We have a green and a red species. The background reflects nuclear DNA composition in space. Circles reflect the spatial distribution of mitochondrial DNA. The black bar represents the hybrid zone between the two species and the grey boundary the geographical overturn between the two mitochondrial DNA types. In both panels mitochondrial DNA of the red species has introgressed into the green one when they started hybridizing. In the top panel the green species subsequently outcompetes the red one and the species boundary moves towards the left. The green individuals at the frontier possess red mitochondrial DNA, and so does their offspring that gradually replaces the red species. Therefore, red but not green mitochondrial DNA is spread into the region of species replacement via the green species (where red mitochondrial DNA is already present in the red species). Hence, the location of the geographical overturn between the two mitochondrial DNA types remains the same. In the bottom panel the location of the hybrid zone between the green and the red species is stable. However, the red mitochondrial DNA is beneficial to the green species and natural selection pulls it further and further into the green range over time. In effect, the geographical overturn between the two mitochondrial DNA types moves towards the left.
In a paper published in BMC Evolutionary Biology we look at a crested newt case of extensive mitochondrial DNA introgression on the Balkan Peninsula. We first delimit a ca. 54,000 km² area in which T. macedonicus contains T. ivanbureschi mitochondrial DNA. This introgression zone bisects the range of T. ivanbureschi, isolating an enclave from the main range. This enclave suggests hybrid zone movement as the cause of the observed asymmetric mitochondrial DNA introgression: it is unlikely that T. ivanbureschi managed to move across a large region inhabited by T. macedonicus (as newts cannot fly), while it is easy to imagine that T. macedonicus locally replaced T. ivanbureschi in the area between the enclave and the main range of T. ivanbureschi. Considering the high similarity of introgressed mitochondrial DNA haplotypes to those found in T. ivanbureschi today, introgression must be of recent origin.
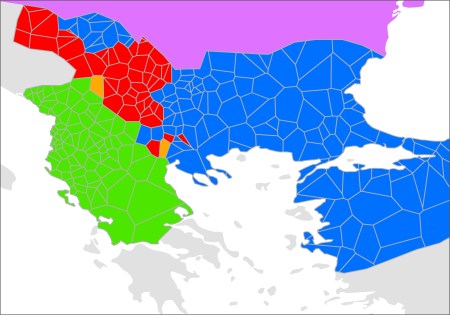 This figure shows the geographical distribution of the two crested newt species and their mitochondrial DNA as Thiessen polygons (a.k.a. a Voronoi diagram). Each polygon covers the area that is closer to its corresponding crested newt locality than to another one. Green and blue polygons represent T. macedonicus and T. ivanbureschi localities with T. macedonicus and T. ivanbureschi mitochondrial DNA, respectively. The red polygons represent T. macedonicus localities with T. ivanbureschi mitochondrial DNA and the orange ones T. macedonicus localities where both T. macedonicus and T. ivanbureschi mitochondrial DNA are present. To delimit the introgression zone, we combined the orange and red polygons. The purple at the top reflects the area where other Triturus species are present, while the grey land (and white sea, obviously) is devoid of Triturus newts.
We make use of species distribution modelling (a.k.a. ecological niche modelling) to obtain insight into hybrid zone movement. In species distribution modelling you determine the ecological conditions at locations where you know a species is present and then you determine where else such conditions occur. Furthermore, if you have reconstructions of ecological conditions for past time periods, you can approximate past ranges. Most hybrid zones observed today were established after the last glaciation of the Quaternary Ice Age came to an end. Species that had their ranges reduced during glacial conditions expanded them again as the climate ameliorated and came into contact with other species that were doing the same. This makes the period since the end of the last glaciation particularly interesting to study with species distribution modelling. Fortunately, climate reconstructions for the Last Glacial Maximum (about 21,000 years ago) and the mid-Holocene (about 6,000 years ago) are available. We construct species distribution models for both crested newt species based on current climate data and project these on climate reconstructions of the two past time slices.
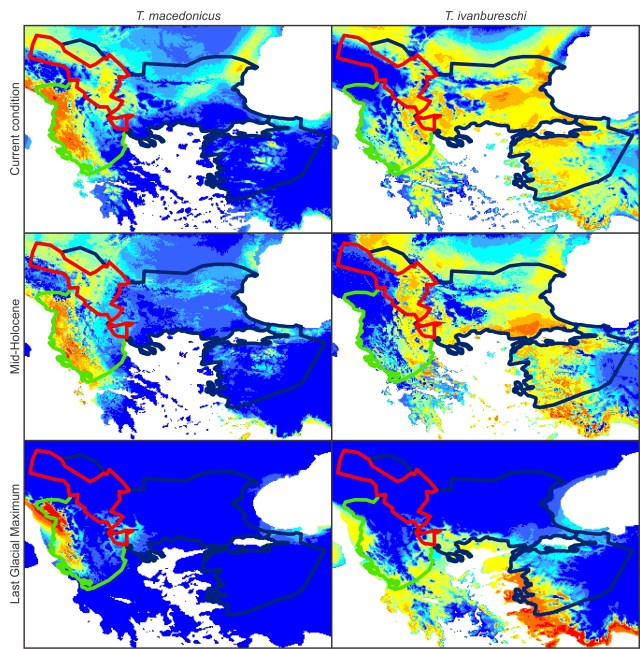 This figure shows species distribution models for T. macedonicus (left) and T. ivanburschi (right) projected on climate layers for the Last Glacial Maximum (bottom), Mid-Holocene (middle) and the present (top). The warmer the color, the more suitable the area. The blue line delineates the T. ivanbureschi range (with T. ivanbureschi mitochondrial DNA). The green line delineates the T. macedonicus range where its own mitochondrial DNA and the red line where this species carries introgressed T. ivanbureschi mitochondrial DNA. As you can see, the introgression zone was inhospitable for either species during the Last Glacial Maximum, suggesting that the pattern we observe today was established at a later stage. However, the zone would have been habitable again at the mid-Holocene. Since that time habitat suitability generally increased for T. macedonicus, while it decreased for T. ivanbureschi.
Taken the results of the mitochondrial DNA survey and the species distribution modelling together we can reconstruct a historical biogeographical scenario for this crested newt case. Based on the arrangement of the ranges of the two crested newt species involved (the enclave), and the insight provided by the mitochondrial DNA phylogeographic structure and species distribution models, we favor the hybrid zone movement rather than the positive selection hypothesis to explain the presence of T. ivanbureschi mitochondrial DNA in a big chunk of the range of T. macedonicus.
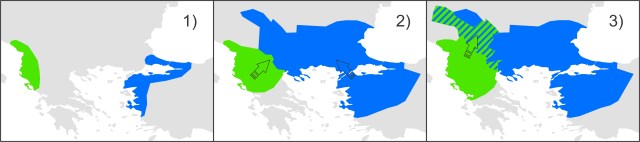 This figure shows a simplified historical biogeographical scenario to explain the observed mitochondrial DNA introgression between the two crested newt species. During the adverse climate conditions of the Last Glacial Maximum, the ranges of T. macedonicus (green) and T. ivanbureschi (blue) were restricted (1). When the climate improved, both species started to expand and obtained secondary contact (2). Subsequently, T. macedonicus invaded area occupied by T. ivanbureschi and locally took over, but as species displacement coincided with hybridization, T. ivanbureschi mitochondrial DNA was left behind in this part of the T. macedonicus range (3).
Reference: Wielstra, B., Arntzen, J.W. (2012). Postglacial species displacement in Triturus newts deduced from asymmetrically introgressed mitochondrial DNA and ecological niche models. BMC Evolutionary Biology 12: 161.
Geographical groups characterised by distinct mitochondrial DNA may still belong to a single species. However, if they are also ecologically distinct, this supports their species status. In a paper published in PLoS ONE we explore ecological differences among the three crested newt candidate species constituting the Triturus karelinii-group. We show that these differences are of a similar order as those observed between recognized crested newt species. Hence, from the perspective of both mitochondrial DNA and ecology, the candidate species are as diverged as ‘real’ species, in line with our hypothesis that they represent cryptic species.
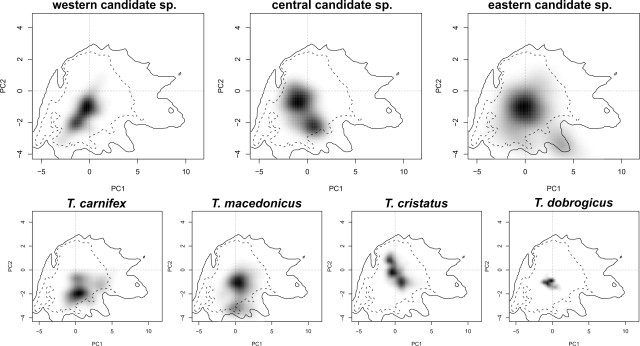 In these squares you see a two dimensional representation of the niche space experienced by all crested newts together. The grey shading reflects the occurrence of each (candidate) species within that niche space.
Reference: Wielstra, B., Beukema, W., Arntzen, J.W., Skidmore, A.K., Toxopeus, A.G., Raes, N. (2012). Corresponding mitochondrial DNA and niche divergence for crested newt candidate species. PLoS ONE 7(9): e47771.
Crested newts comprise four ‘morphotypes’: 1) the Triturus karelinii-group, 2) T. carnifex + T. macedonicus, 3) T. cristatus, and 4) T. dobrogicus. These four morphotypes range from sturdy to slender bodies. Body build is reflected by the number of rib-bearing pre-sacral vertebrae (NRBV), running from NRBV=13 (most sturdy) to NRBV=16 (most slender). Hence, NRBV approximates body build in crested newts. A final fun fact is that crested newt morphotypes differ ecologically. Body build is related to the duration of the annual aquatic period, which runs from three months for NRBV=13 to six months for NRBV=16. This suggest that ecology might have driven the crested newt radiation.
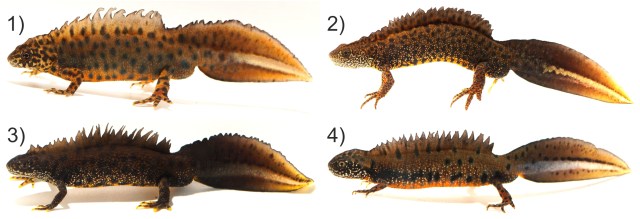
To understand how this radiation of body shapes originated in crested newts, we should look at their evolutionary tree (their phylogeny). However, despite several previous attempts, employing a variety of molecular markers, phylogenetic relationships among crested newt morphotypes have never been resolved. For four morphotypes, 15 topologies are possible. The number of additions or subtractions of rib-bearing vertebrae during crested newt evolution differs between these topologies. So how flexible was NRBV during crested newt evolution?
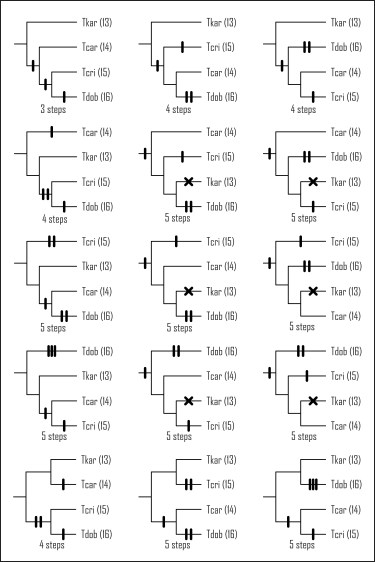
In a paper in BMC Evolutionary Biology we finally manage to obtain a well-supported, fully resolved crested newt phylogeny, by using complete mitochondrial genome sequences. We can now look at the evolution of the radiation in body build in crested newts, in the context of the new phylogeny. By taking a step back and looking at NRBV values in other salamanders, we can give NRBV evolution a direction. Most salamanders have a relatively low NRBV=13. Therefore, the root of the crested newt tree, furthest back in time, can be set at NRBV=13 as well. This means that the proto crested newt likely had a low NRBV value, like the T. karelinii-group today (which is also 13), while the higher NRBV values seen in crested newts probably evolved at a later stage.
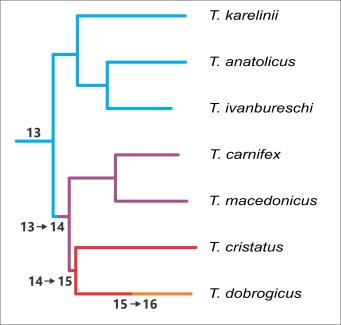
A basal dichotomy separates the T. karelinii-group (NRBV=13) from the remaining crested newts. The next split divides T. carnifex + T. macedonicus (NRBV=14) versus the rest. Finally there is a divide between T. cristatus (NRBV=15) and T. dobrogicus (NRBV=16). To explain the evolution of NRBV, given the new phylogeny, three additions of a rib-bearing vertebrae are required. This actually is the minimal number of steps possible to explain the variation in NRBV observed today (in technical terms, the new phylogeny supports a maximally parsimonious interpretation of NRBV evolution). The new phylogeny makes sense!
Reference: Wielstra, B., Arntzen, J.W. (2011). Unraveling the rapid radiation of crested newts (Triturus cristatus superspecies) using complete mitogenomic sequences. BMC Evolutionary Biology 11: 162.
In a paper in the Journal of Zoological Systematics and Evolutionary Research we explore the evolution of body form in crested newts. In general crested newts started out with large bodies with a short trunk and a wide head. Over time smaller bodies with a longer trunk and narrower had were added to the crested newt repertoire. Ecology likely played an important role in the radiation of body shapes in crested newts.
Reference: Vukov, T.D., Sotiropoulos, K., Wielstra, B., Džukić, G., Kalezić, M.L. (2011). The evolution of the adult body form of the crested newt (Triturus cristatus superspecies, Caudata, Salamandridae). Journal of Zoological Systematics and Evolutionary Research 49(4): 324-334.
Within the crested newt assemblage, known as the Triturus cristatus superspecies, T. karelinii has been severely understudied. Limited data suggests there might me more than one species involved and the systematic position within the crested newt superspecies is unclear. Furthermore, T. karelinii occurs in a region that is understudied from a biogeographical point of view: the Near East. Time to take a closer look!

This ‘geophylogeny’ shows a mitochondrial DNA phylogeography for Triturus karelinii plotted on a map. Note that there are three distinct clades, with their approximate range in different shades of blue.
In a paper published in Molecular Phylogenetics and Evolution, we present a range-wide mitochondrial DNA phylogeography. We show that T. karelinii is a monophyletic group that comprises three very distinct, geographically structured lineages. They are as different from one another as recognized crested newt species are. We also provide a historical biogeographical scenario to explain the origin of these lineages.
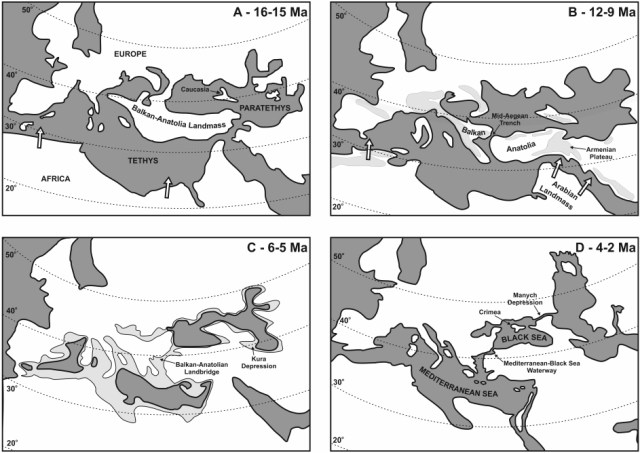
In the paper we explain the origin of the genetic variation in T. karelinii in the context of the paleogeology of Eurasia.
Reference: Wielstra, B., Espregueira Themudo, G., Güclü, Ö., Olgun, K., Poyarkov, N.A., Arntzen, J.W. (2010). Cryptic crested newt diversity at the Eurasian transition: the mitochondrial DNA phylogeography of Near Eastern Triturus newts. Molecular Phylogenetics and Evolution 56(3): 888-896.
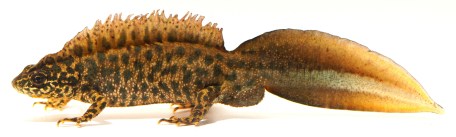 Male crested newt of the T. karelinii-group (now called T. ivanbureschi). Picture by Michael Fahrbach.
The Triturus karelinii-group of crested newts has sometimes been considered to comprise two species, ‘T. karelinii proper’ in the east and ‘T. arntzeni’ in the west. Three hypotheses on the position of the boundary between the two have been suggested 1) somewhere in Thrace, 2) aligning with the sea strait system separating Europe and Asia, or 3) somewhere in western Anatolia. In a paper published in Amphibia-Reptilia we analysed allozyme data from Europe and north-western Turkey. We identified an eastern and a western group, in line with a two species treatment. These two groups show genetic admixture in western Anatolia, in line with hypothesis 3. However, the transition between the species is messy and unfortunately the eastern group is undersampled. Furthermore, two deeply divergent mitochondrial DNA clades suggest the transition between the two groups should be positioned further to the east. More questions than answers! Obviously, a more detailed survey on the crested newts of the Triturus karelinii-group is required.
Reference: Arntzen, J.W., Wielstra, B. (2010). Where to draw the line? A nuclear genetic perspective on proposed range boundaries of the crested newts Triturus karelinii and T. arntzeni. Amphibia-Reptilia 31(3): 311-322.
As the crested newts radiated in a short temporal interval, a relatively long time ago, it has proven extremely difficult to resolve their phylogenetic relationships. This might mean they truly did split simultaneously, or the amount of data studies may not have been sufficient. In a paper in Molecular Phylogenetics and Evolution we take another attempt to resolve the crested newt phylogeny. This time around we use sequence data for several nuclear and mitochondrial genes. I don’t think it actually got us much closer to a resolved phylogeny!
Reference: Esprequeira Themudo, G., Wielstra, B., Arntzen, J.W. (2009). Multiple nuclear and mitochondrial genes resolve the branching order of a rapid radiation of crested newts (Triturus, Salamandridae). Molecular Phylogenetics and Evolution 52(2): 321-328.
 The genus Triturus comprises the marbled newts (such as T. pygmaeus on the left) and the crested newts (such as T. karelinii on the right). Pictures by Michael Fahrbach.
Despite the genus Triturus (in my humble opinion) being a model system in evolutionary research , the phylogenetic relationships among the different crested newt species have never been resolved. In a paper published in Contributions to Zoology, we consulted allozyme and mitochondrial DNA data to try and rectify this situation. However, despite the large amount of data, we did not manage to improve on the situation. The fuzziness of crested newt relationships might well reflect an actual simultaneous split. We compare time estimates of the crested newt radiation for the allozyme and mitochondrial DNA dataset. We conclude that only the latter can be brought in line with potential geological drivers and provide a biogeographical scenario. This paper was a good opportunity to split the distinct T. macedonicus from T. carnifex, we thought.
Reference: Arntzen, J.W., Esprequeira Themudo, G., Wielstra, B. (2007). The phylogeny of crested newts (Triturus cristatus superspecies): nuclear and mitochondrial genetic characters suggest a hard polytomy, in line with the paleogeography of the centre of origin. Contributions to Zoology 76(4): 261-278.


 Wielstra Lab