
You can only learn so much about a study system if you have few genetic markers available. Particularly if that study system has an extensive history of hybridization, as is the case for Triturus. Because salamanders have massive and complex genomes it is not possible to simply sequence one. Not yet at least. Luckily we had some Triturus transcriptome data laying around. The transcriptome contains messenger DNA – the transcripts of functional genes – but not the long introns and endless repeats that torment salamander genomes. Hence it provides relatively simple, genome-wide reference data for marker design. After designing a large set of markers, I tested which of these worked for all crested newt species and multiplexed the successful ones for a large set of newts. Next the whole bunch was sequenced at Naturalis’ next-generation sequencing facility on an Ion Torrent machine and subsequently the huge amount of genetic data was sorted out with a bioinformatics pipeline and converted it to a workable format. It sounds easy, but it was quite an undertaking.

The top picture shows the localities sampled (circled numbers, three newts each) and the bottom picture shows the probability with which they belong to their own species (all 1, as would be expected if our method works).
Using data for a set of newts representing all species and also some putative hybrids we showed that the protocol can be used to allocate individuals to the proper species and pick out genetically admixed newts. Although the amount of markers is still relatively modest, the data provide a very detailed picture on the genetic composition of crested newts. A paper describing the methodology has recently been published in Molecular Ecology Resources. Basically we can now provide a detailed picture of the distribution of the different species and the genetic distinction of and gene flow between these species: an important next step in my research. Meanwhile I have sequenced about 1500 individuals throughout the range of Triturus as the basis for quite some papers to come. Stay tuned!

These are a couple of newts from the population marked with an H on the map above. You can click on the picture to see a larger version. The throat and belly pattern is very variable in this populations. Some animals look more like macedonicus or ivanbureschi and the ones depicted here look especially messy. Based on the Ion Torrent data these newts indeed show mixed macedonicus and ivanbureschi genetic ancestry and almost all are identified as backcrosses towards ivanbureschi (with the remainder being F2 hybrids).
By the way, many thanks to Wieslaw Babik, Michał Stuglik and Piotr Zieliński from Jagiellonian University, Krakow, Poland for helping with the design of this protocol!
Reference: Wielstra, B., Duijm, E., Lagler, P., Lammers, Y., Meilink, W., Ziermann, J.M., Arntzen, J.W. (2014). Parallel tagged amplicon sequencing of transcriptome-based genetic markers for Triturus newts with the Ion Torrent next-generation sequencing platform. Molecular Ecology Resources 14(5): 1080-1089.
![]()

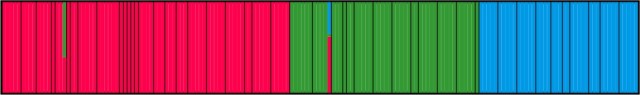 This plot shows individuals (thin bars) within populations (thick bars) roughly ordered from west to east. Based on their genotype, individuals are allocated (0-100%) to three geographical genetic groups (represented by different colors).
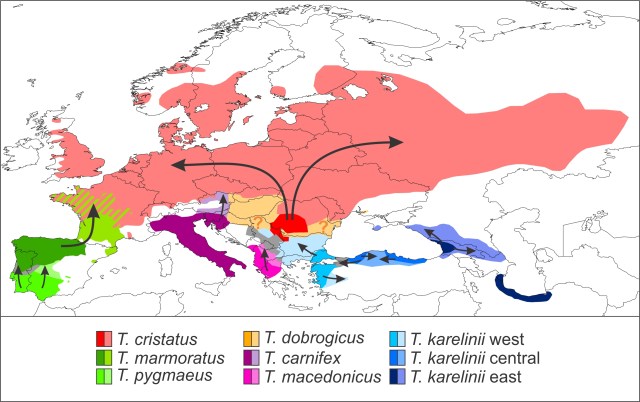
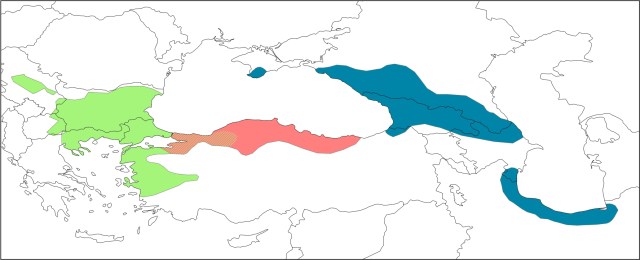 Here you see the three cryptic species that make up the T. karelinii-group of crested newts. An intriguing finding is that asymmetric DNA introgression from the western group into the central group (the red-green hatched area). We suggest that this pattern can be explained by the central group having expanded its range at the expense of the western group, while the two hybridized in the process. An interesting hypothesis to test in a future study!


 This figure shows how mitochondrial DNA can be transferred across the species boundary via introgressive hybridization. Large circles reflect the nuclear DNA composition of individuals and small ones their mitochondrial DNA type. There is an initial hybridization event between the members of two species, a red female and a green male. The F1 offspring contain a mix of red and green nuclear DNA, as this is inherited from both parents, but only red mitochondrial DNA, because mitochondrial DNA is only transmitted via the mother. Over subsequent generations, admixed females mate (backcross) with green males. In time the red nuclear DNA dilutes out and in effect we end up with a species that, from the nuclear DNA perspective, is completely green, but that possesses red mitochondrial DNA.
 This figure shows two scenarios that could result in geographically asymmetric mitochondrial DNA introgression. We have a green and a red species. The background reflects nuclear DNA composition in space. Circles reflect the spatial distribution of mitochondrial DNA. The black bar represents the hybrid zone between the two species and the grey boundary the geographical overturn between the two mitochondrial DNA types. In both panels mitochondrial DNA of the red species has introgressed into the green one when they started hybridizing. In the top panel the green species subsequently outcompetes the red one and the species boundary moves towards the left. The green individuals at the frontier possess red mitochondrial DNA, and so does their offspring that gradually replaces the red species. Therefore, red but not green mitochondrial DNA is spread into the region of species replacement via the green species (where red mitochondrial DNA is already present in the red species). Hence, the location of the geographical overturn between the two mitochondrial DNA types remains the same. In the bottom panel the location of the hybrid zone between the green and the red species is stable. However, the red mitochondrial DNA is beneficial to the green species and natural selection pulls it further and further into the green range over time. In effect, the geographical overturn between the two mitochondrial DNA types moves towards the left.
 This figure shows the geographical distribution of the two crested newt species and their mitochondrial DNA as Thiessen polygons (a.k.a. a Voronoi diagram). Each polygon covers the area that is closer to its corresponding crested newt locality than to another one. Green and blue polygons represent T. macedonicus and T. ivanbureschi localities with T. macedonicus and T. ivanbureschi mitochondrial DNA, respectively. The red polygons represent T. macedonicus localities with T. ivanbureschi mitochondrial DNA and the orange ones T. macedonicus localities where both T. macedonicus and T. ivanbureschi mitochondrial DNA are present. To delimit the introgression zone, we combined the orange and red polygons. The purple at the top reflects the area where other Triturus species are present, while the grey land (and white sea, obviously) is devoid of Triturus newts.
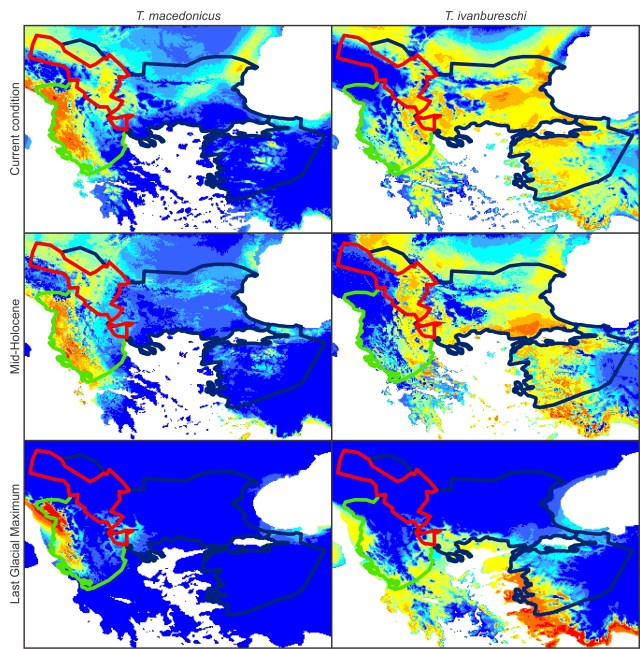 This figure shows species distribution models for T. macedonicus (left) and T. ivanburschi (right) projected on climate layers for the Last Glacial Maximum (bottom), Mid-Holocene (middle) and the present (top). The warmer the color, the more suitable the area. The blue line delineates the T. ivanbureschi range (with T. ivanbureschi mitochondrial DNA). The green line delineates the T. macedonicus range where its own mitochondrial DNA and the red line where this species carries introgressed T. ivanbureschi mitochondrial DNA. As you can see, the introgression zone was inhospitable for either species during the Last Glacial Maximum, suggesting that the pattern we observe today was established at a later stage. However, the zone would have been habitable again at the mid-Holocene. Since that time habitat suitability generally increased for T. macedonicus, while it decreased for T. ivanbureschi.
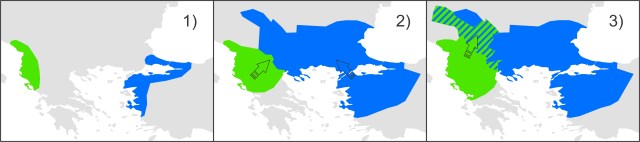 This figure shows a simplified historical biogeographical scenario to explain the observed mitochondrial DNA introgression between the two crested newt species. During the adverse climate conditions of the Last Glacial Maximum, the ranges of T. macedonicus (green) and T. ivanbureschi (blue) were restricted (1). When the climate improved, both species started to expand and obtained secondary contact (2). Subsequently, T. macedonicus invaded area occupied by T. ivanbureschi and locally took over, but as species displacement coincided with hybridization, T. ivanbureschi mitochondrial DNA was left behind in this part of the T. macedonicus range (3).