Where recently diverged species meet in nature, they often hybridize and exchange genes. The regions where this genetic intermingling occurs are called hybrid zones. If one member of a hybridizing pair of species displaces the other, their hybrid zone would in consequence move. For hybrid zones studied over decades, little shifts have occasionally been observed ‘live’. Of course a decade is next to nothing on an evolutionary time scale and over thousands of years a hybrid zone could potentially travel a considerable distance. Yet, theory predicts that moving hybrid zones quickly stabilize at barriers of less suitable habitat (so-called density troughs). So what’s the deal?
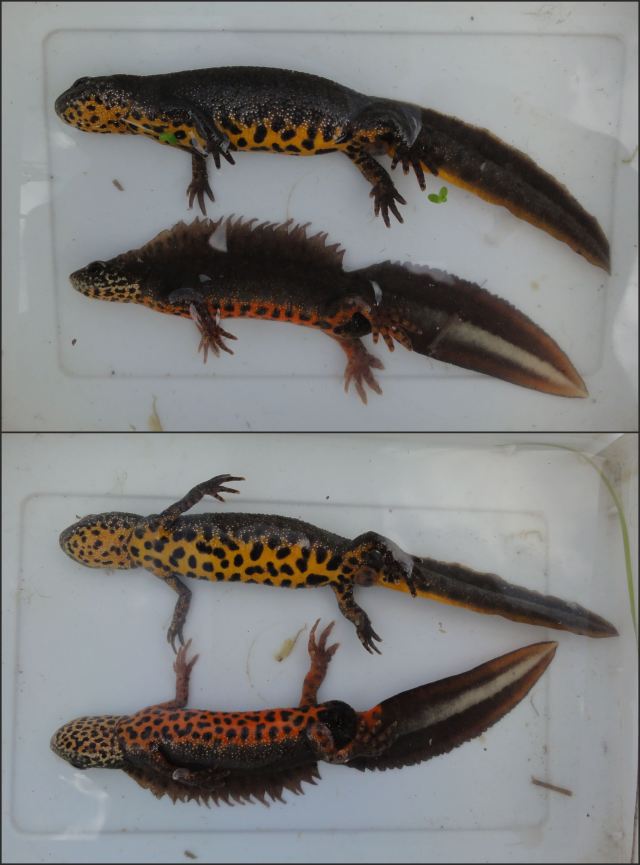
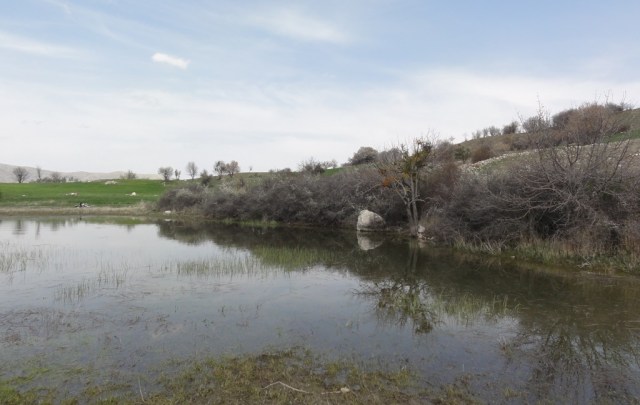
 A male crested newt from a hybrid pond.
A key prediction of hybrid zone movement is that selectively neutral genes of the displaced species introgress into the expanding one en masse, while gene flow in the opposite direction is negligible. In effect the receding species leaves behind a trail of genes within the advancing species. Such a ‘genomic footprint’ of hybrid zone movement could be uncovered by screening dozens of genes. To conduct this test of long-term movement, we had better study a hybrid zone for which a shift in position is likely to begin with. Triturus provides: we previously hypothesized that in Turkey the recently recognized T. anatolicus has been expanding at the expense of T. ivanbureschi, as their hybrid zone moved to the west. Using the Ion Torrent protocol we sampled a lot of newts from many localities throughout the range of both species.
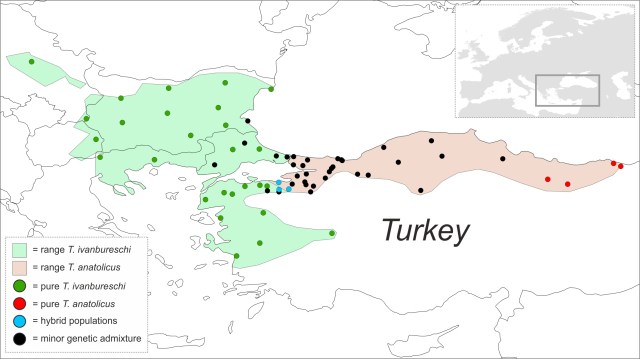 The ranges of the two crested newt species are shown green and red. Pure green or red dots are populations where animals are genetically pure and the blue dots are hybrid populations (with genes of both species at high frequency). Black dots represent populations of one species where genetic traces of the other are present. Black dots are much wider distributed in the red than in the green species.
In a paper just published in the new journal Evolution Letters, we show that introgression between the two crested newt species is strongly biased. As predicted, we find considerably more genes of T. ivanbureschi in T. anatolicus then the reverse. This asymmetric introgression spans an extensive area. Our findings provide powerful evidence for a scenario in which T. anatolicus has been displacing T. ivanbureschi, while the two hybridized in the process. Theory be damned, the crested newt case strongly suggests that hybrid zone movement can proceed over considerable time and space! Hybrid zones are probably much more mobile than currently appreciated.
 When plotting the fraction of genetic material derived from each species (ancestry) vs. the fraction of genes that posses a copy of either species (heterozygosity), a pure ‘green species’ would turn up in the lower left and a pure ‘red species’ in the lower right corner, while an F1 hybrid between the two species would end up in the upper corner. Plotted individuals are more widely spread in the lower right than in the lower left corner. This means that there are much more red individuals that possess some green genes, rather than the other way around.
Reference: Wielstra, B., Burke, T., Butlin, R.K., Avcıc, A., Üzüm, N., Bozkurt, E., Olgun, K., Arntzen, J.W. (2017). A genomic footprint of hybrid zone movement in crested newts. Evolution Letters 1 (2): 93-101.
Reference: Wielstra, B., Arntzen, P. (2018). Schuivende hybridezones in kamsalamanders: hybridezones blijken beweeglijker dan gedacht. RAVON 20(4): 64-67.

I initiated this work as a Newton International Fellow. This project has received funding from the European Union’s Horizon 2020 research and innovation programme under the Marie Skłodowska-Curie grant agreement No. 655487.


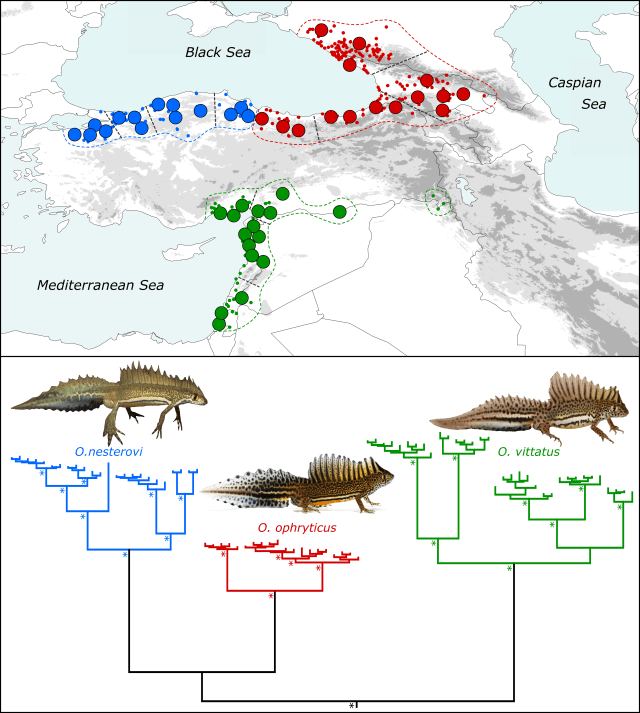
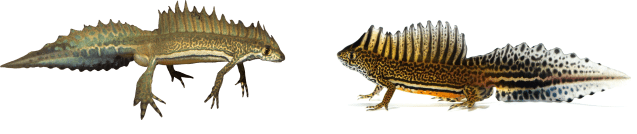 Ommatotriton nesterovi (left) and O. ophryticus.
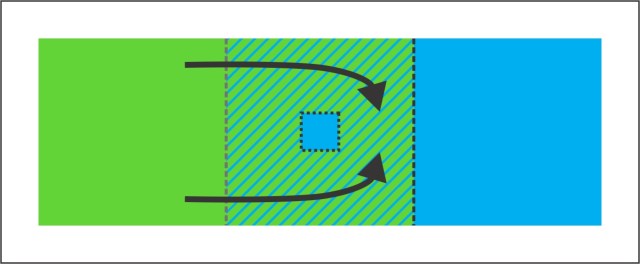 A scenario in which an enclave is created via incomplete species replacement. A green species expands to the right and replaces a blue one. However, a relict population of blue persists locally within the green range. If the two species hybridize, a genomic footprint of hybrid zone movement would be expected in the part of the green range that was formerly occupied by the blue species (on the right side of the grey dotted line).
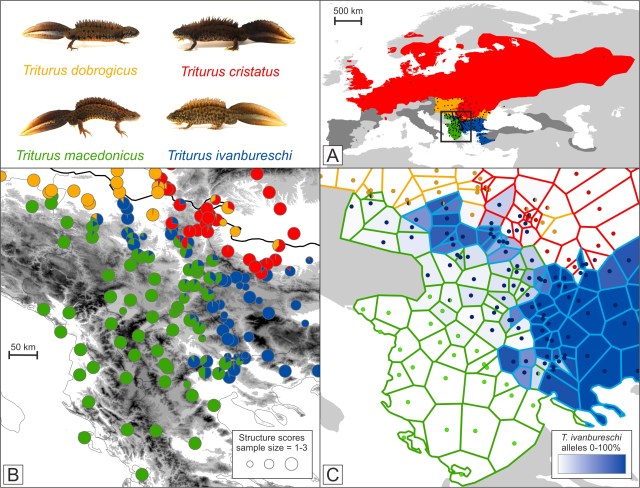 In panel A the range of the genus Triturus is shown, with approximate outlines of the ranges of the four species under study shown in color (ranges of additional Triturus species are in dark grey). Dots are sampled localities. The box delineates part of the Balkan Peninsula, highlighted in the other panels. In panel B pie diagrams illustrate the average genetic composition per locality, with pie slices colored according to species. In panel C each polygon represents a locality and includes the area that is closest to that locality, rather than another one. The border of each polygon is colored according to the genetically dominant species. The blue shading of polygons reflects the proportion of alleles that are diagnostic for the crested newt species with the enclave (T. ivanbureschi) at that locality. Finally, the dots reflect the actual position of each locality and are colored according to the type of mitochondrial DNA present. What this admittedly rather complicated picture shows is that a blue enclave (belonging to the species T. ivanbureschi) is disconnected from the main range because the range of a green species (T. macedoncius) intervenes. In the part of the range of the green species where we expect that it replaced the blue species, we find genetic traces of that blue species, just as we predicted.


 Male T. dobrogicus. Picture by Michael Fahrbach.